The “Big One” is Coming — Or is it?
December 13, 2016
If you look at models as much as I do, you see them stir up some crazy forecasts from time to time, sometimes predicting feet of snow for areas that may see a few inches or less. How can we gauge the confidence in the models? Ensemble forecasts are the answer!
I’m not just a meteorologist; I’m also a mathematician. Let’s forget about meteorology for a moment and talk about math for a moment. This detour has relevance, I promise, so bear with me. Let’s say I’m modeling water leaking from a tank and I know how the rate at which the water leaks out as a function of time, let’s call it f(t). I can represent this as a differential equation and by solving this equation, I get the amount of water in the tank after some time t. If I know how much water is in the tank to begin with, I can impose an initial condition on the differential equation. Let’s say there’s 100 liters in the tank, then f(0)=100 is the initial condition.
What if I don’t know how much water is in the tank? There could be 95 liters, 100 liters, 105 liters… Every time I change the initial conditions, that’s called a perturbation; If I toss a rock into a still pond, I am causing a perturbation. I could solve the equation for as many initial conditions as I want. If I impose three different initial conditions, I get three solutions for f(t). I could take this one step further and ask how much variation is in these solutions. The amount of variation can be quantified by a statistical measure called the standard deviation; the higher the standard deviation, the higher the variance among whatever I’m measuring. If I’m measuring kids’ heights, a high standard deviation means there’s some tall kids and some short kids in my sample; if the standard deviation is low, they’re all about the same height. Note that a low standard deviation says nothing about height; they could be all tall or all short.
What does this have to do with your forecast? Ensemble forecasts work by tweaking the initial conditions of a model to give a range of forecast possibilities. What you see on an ensemble forecast (usually) is a mean and some type of variance measure (such as standard deviation). If I look at an ensemble and see a high standard deviation, that’s a clue to me that the model doesn’t have a good grasp on the forecast. If, on the other hand, the standard deviation is low, then there’s more confidence in the forecast. Here is an example of what I see when I look at an ensemble forecast.
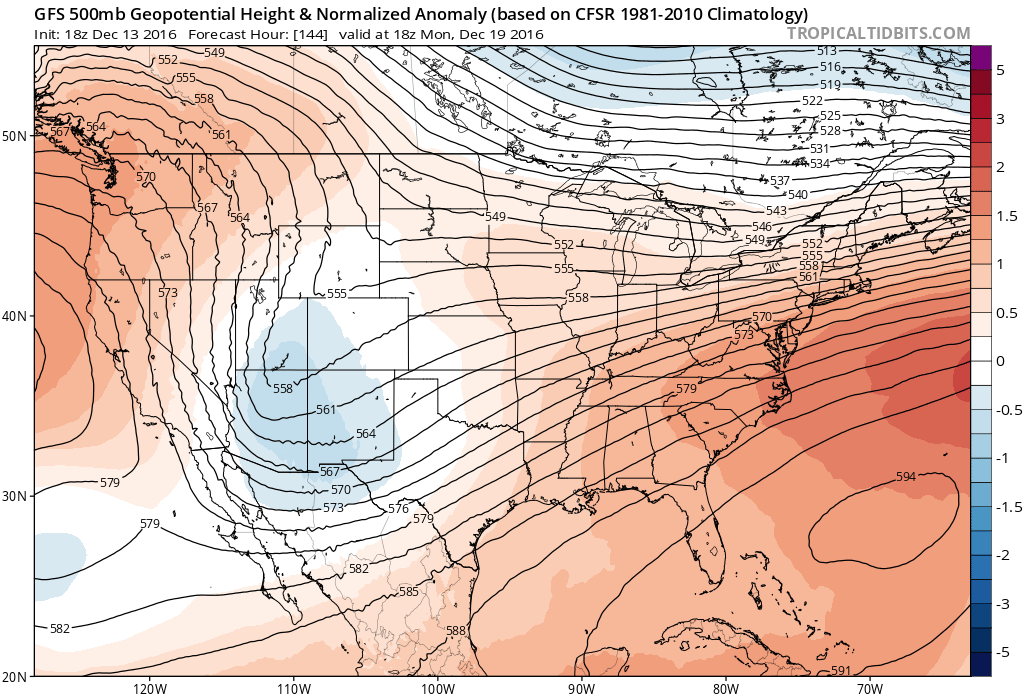
The contours represent the mean of all of the forecasts and the shades represent the standard deviations. In the case of the image above, the model seems to have a fairly good handle on the forecast. However, this does not mean that the situation played out by the model will actually take shape. You still need to analyze the models as you would any other time. This is one reason that if you’re not seeing me talking about a major winter storm that everyone else is; if standard deviations are high, there’s not a lot of confidence in the forecast produced by that particular model.